Events
Virtual Graduation
Due to the Covid-19 pandemic we had to unfortunately had to cancel our in-person ceremony. We at the department still wanted to honor our graduates and to do that we created this virtual ceremony. If you can take your time to view it and say a congratulations to those who graduated, we at the department would greatly appreciate it. And a special thanks to Phillip Fry, Department of Mathematics Business Coordinator, who put together the video.
Michalik Distinguished Lecture Series
 On February 28, 2020, Dr. Bernd Sturmfels, who is the Director of the Max-Planck Institute for Mathematics in Sciences, Leipzig, Germany and a Professor of Mathematics, Statistics, and Computer Science at the University of California at Berkeley, gave the 2020 Edmund R. Michalik Distinguished Lecture in the Mathematical Sciences to a packed room full of students and faculty from Pitt and Carnegie Mellon. Two fundamental pillars of mathematics, algebra and geometry, come together in the study of properties of geometric objects. For example, counting the number of intersections of two solids gives rise to a problem in algebra. Dr. Sturmfels works at this interface, both in developing theory and in using computer-based methods, and on applications that arise in an impressive variety of fields including statistics and computational biology. In his lecture, Dr. Sturmfels illustrated these methods in the study of a famous 19th century geometry problem, sometimes known as “Steiner’s conic problem,” on the tangency of conics. From there, he went on to discuss other ideas in enumerative algebraic geometry, or counting of solutions satisfying sets of geometric constraints, and in numerical algebraic geometry, which seeks to actually produce the identified solutions in particular cases. He concluded by discussing applications to the statistical problem of maximum likelihood estimation, which relates to computing a solution that is most likely to fit given data. This wonderful lecture highlighted both the beauty and the utility of mathematics, providing a nice reminder that these two properties are naturally complementary, not necessarily distinct!
Puzzels in the Pattern of Plagues
By Bard Ermentrout
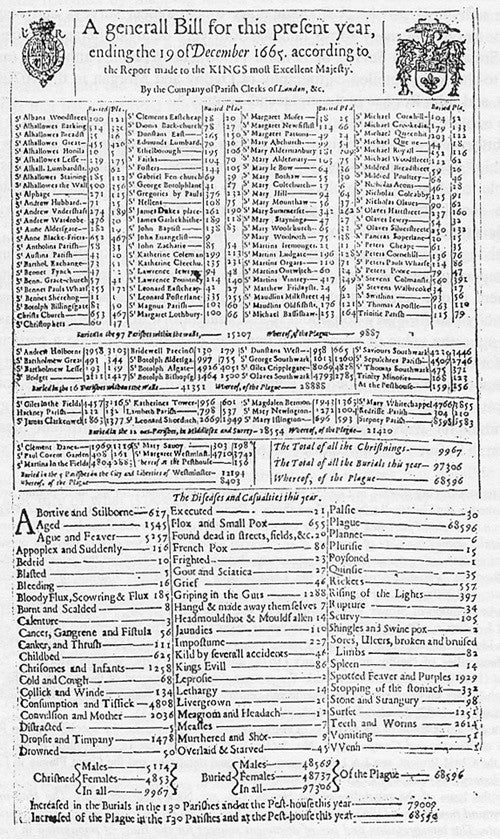
In early February before the country was hit with a new plague, the math department hosted a talk by Professor David Earn about the original plague, titled “Puzzles in the Pattern of Plagues”. As most of you probably know, the Black Death, killed 60% of Europe in the 1300's and there were many other repeated bouts of plague up until the beginning of the 20th century. In fact, during the 1665 plague, Isaac Newton formulated calculus, optics, and the universal law of gravitation while "sheltered in place" away from Cambridge. After providing us with many interesting historical tidbits about the plague and its effects on humanity, Dr. Earn took us into a deep data mining exploration. Indeed, how can we describe the spread of plague in human population? We need written records, death certificates, and other literature from the historical times of the plagues, such as Samuel Pepys famous ``Diary''. With these records, it was easy to see the classic "Gaussian-like" rise and fall of the deaths from plague over multiple epidemics in 17th century London where each bout killed about 20% of the population. However, to discover what happened in earlier epidemic, it requires a much deeper dive into the kinds of records available. Records of probated wills from the 1300s were recently made publicly available and with these, Dr. Earn was able to plot the progress of the plague in these early epidemics.
To quantify the spread of the plague requires a more nuanced look at the data. The classic model for the spread of disease is the well-known SIR model in which the Susceptible population meets with the Infected and becomes infected at some rate before recovering or dying and thus being Removed. However, this model makes many assumptions and, while it can fit the data quite well, the confidence in the parameters is quite low. Instead, Dr. Earn suggests that we let the data guide the analysis. For example, the initial growth rate of the epidemic can be estimated by fitting a line to the log of the data (as this rise is usually exponential). But even this is fraught as the data is quite messy and one could envision multiple different lines for the same data. The problem is that epidemics remain exponential in growth only for a short while before they begin the "flatten the curve''. Dr. Earn and his colleagues solved this issue by fitting to a saturating function (a logistic curve) rather than an exponential. Once he did this, he was able to show that later plagues grew 4x faster than the earlier plagues. Intuitively, the doubling time in 1348 was 45 days while in 1665 it was only 10 days.
Dr. Earn concluded his talk by animating the spatial dynamics of the plague of 1665 using the parish records from the London neighborhoods. All in all it was a remarkably prescient talk given what we are all currently going through. So now, in your time at home, invent some new mathematics!