John Burkardt
Scientists understand the basic physical laws that govern the chemical reactions involved in the growth of living things. However, the actual growth process is so complicated that for now, they are simply searching for models that can simulate what is going on. If such a model could reproduce some growth behavior, then it may provide insight into how to understand what is going on. In growth, we see a collection of cells take on a convex polygonal shape, with neighboring cells sharing a flattened boundary, while each cell nucleus stays roughly in the center. The growth rate varies by location, sometimes in proportion to the distance from some growth center. The cells tend to form layers, especially an outer layer that provides a protective boundary or skin.
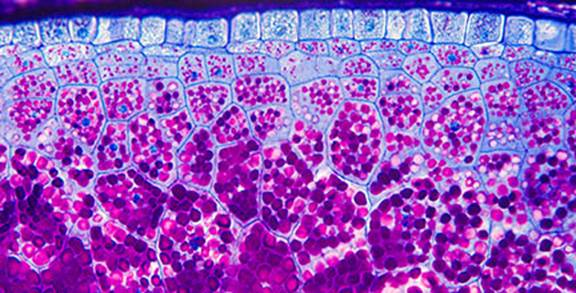
One suggested mathematical model comes from a geometric structure known as the Voronoi diagram. The Voronoi diagram considers a scattering of special points or "nodes" contained within some bounding line. The Voronoi diagram treats each node like a state capital, and creates a "state" around it by having each point in the region assigned to the nearest state capital. While the Voronoi diagram organizes the plane, there may be a great irregularity in the size and shape of these "states", and most nodes will not be centrally located. The Centroidal Voronoi Tessellation allows the position of the nodes to be adjusted in such a way that they are centrally located; moreover, the "states" will tend to have the same size and shape. Plotting the codes and the boundaries of the "states" can suggest a biological structure such as a slice through a honeycomb.

Two modifications to the CVT idea help us to do a more interesting simulation of biological growth. By adding a weight function, (a sort of population density) we can allow a smooth variation in the size of the regions. We can arrange this so we have larger cells in the center of the region, and smaller ones as we go outward. It is also possible to modify the CVT idea so that some points, however reluctantly, are pushed to form a smooth boundary, whereas in a pure CVT, no points would appear there.The program cvt_corn.m demonstrates some of these ideas by "growing" a corn kernel, which starts out as a circular area containing cells, randomly placed in the interior and on the boundary. The program simulates growth by applying the CVT algorithm with a nonuniform density, adjusting the boundary layer, and randomly adding new biological cells along the boundary layer at each step. As the number of cells increase, the corn kernel is also allowed to grow in size, while staying circular.

Since we don't have much data to work with, we are free to choose and adjust such quantities as the nonuniform density function, the number and initial placement of cells, the rate of growth. What we are looking for is "phenomenology", that is, can our process make pictures that roughly correspond to what is seen in nature?
Dr. David Swigon
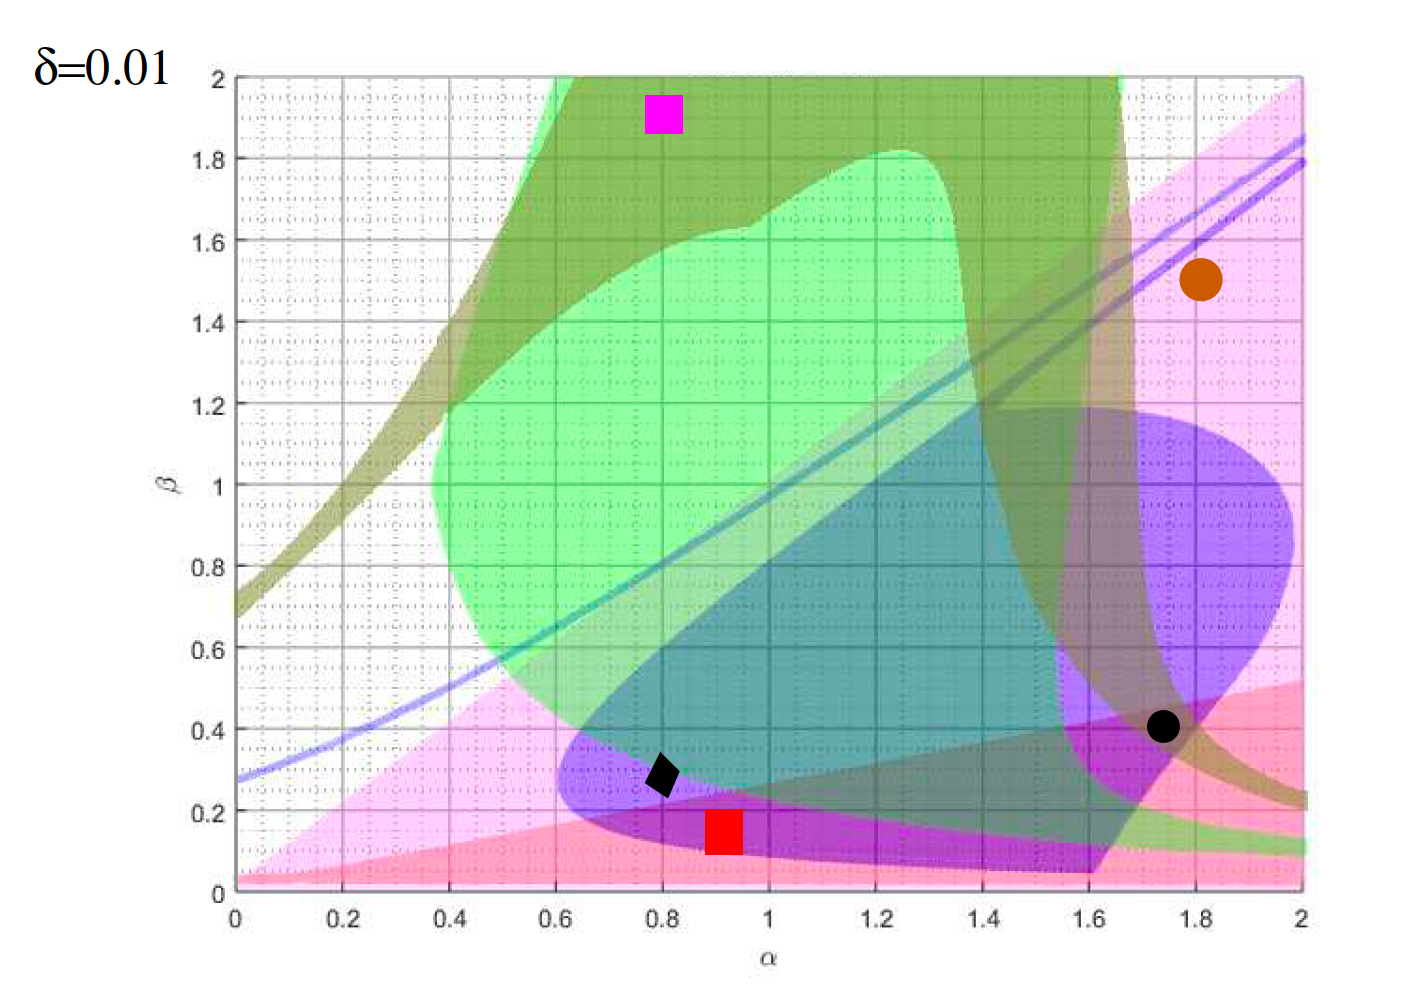
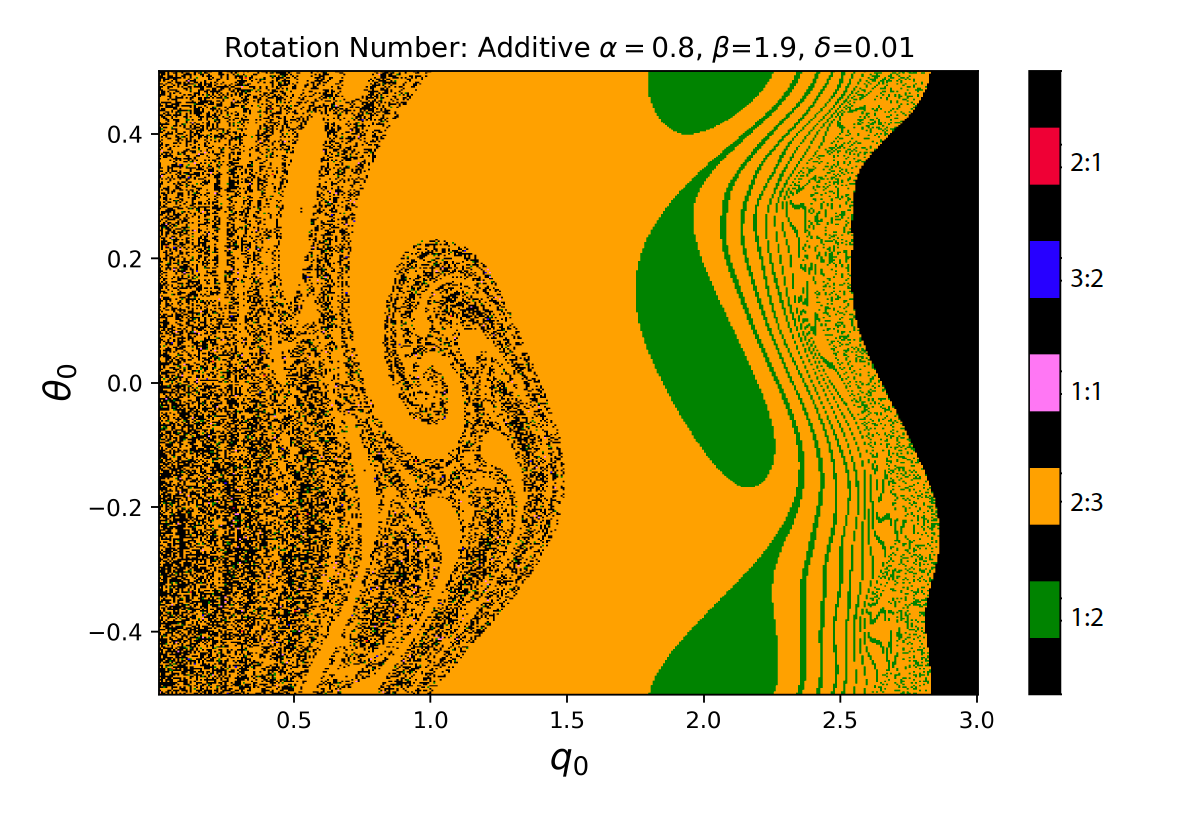
This project with undergrad Mariya Savinov and David Swigon studies a simple model for following a beat, such as from a metronome. In the model the agent can change his rate of tapping as well as the relative time he taps with respect to the metronome. The regions of stability shows that there are many possible beat patterns as the sensitivity parameters alpha and beta vary. Alpha is how easily he changes his timing and beta is how easy he changes his frequency of tapping. The colors represent how many finger taps there are with each metronome beat. There are many overlapping regions suggesting that there can be many responses to the same stimulus depending on your starting conditions. This is illustrated in the second figure (basins) that shows how your initial timing and (y-axis) and frequency (x-axis) impact your final tapping pattern. The colors correspond to your final tapping rhythm - 2 taps to 3 beats (orange) vs 1 tap to 2 beats of the metronome (green).
Dr. Bard Ermentrout
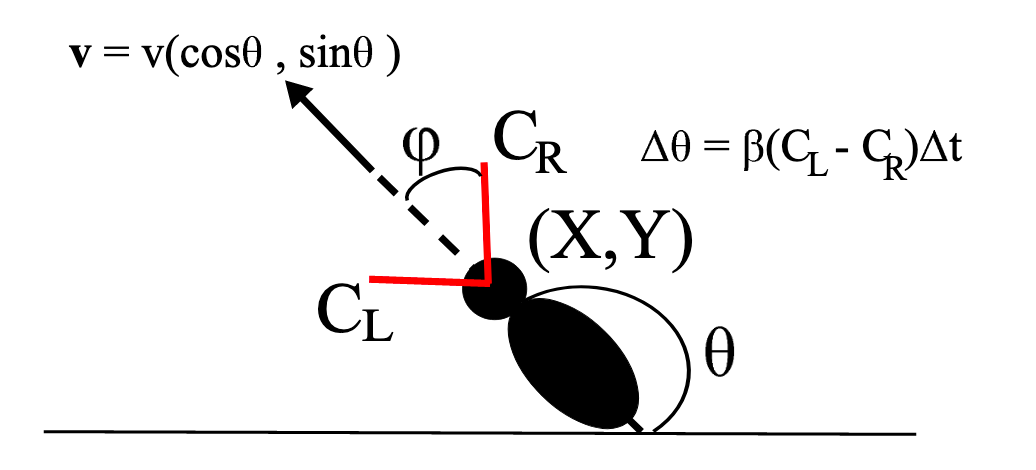
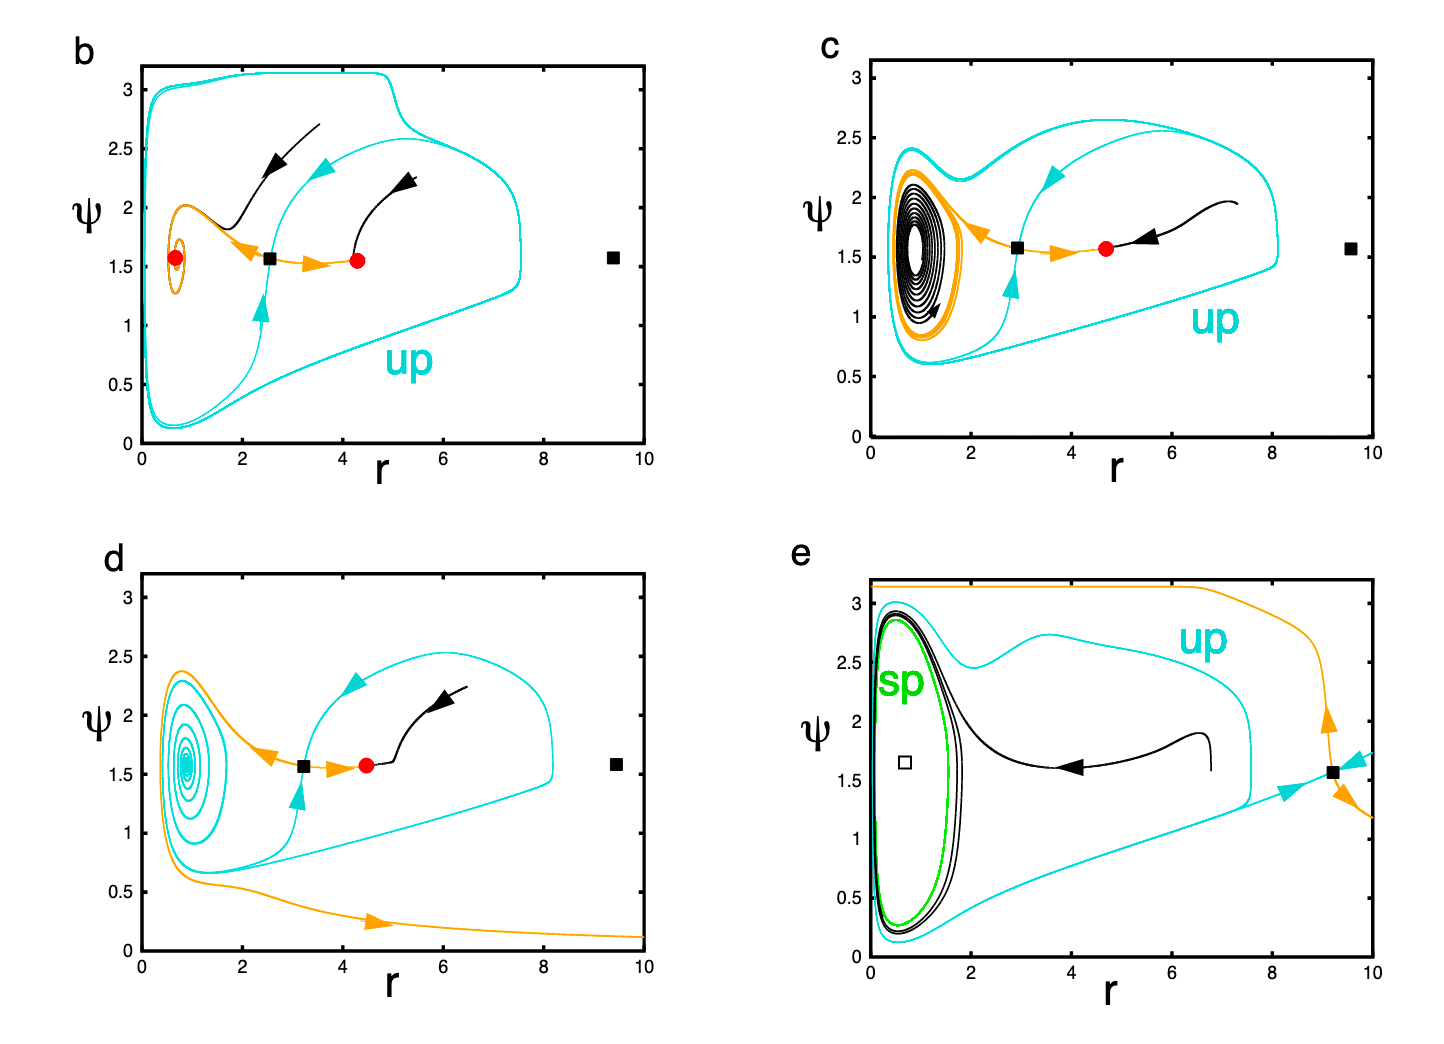
This is work done with grad student Nour Riman, and collaborators, Jonathan Victor and Sebastian Boie and will appear in SIAM Review in the Spring 2021.The paper concerns a simple model for trail following using two sensors like the antenna of an ant (as shown in the diagram) and moving in the direction of highest concentration. The animal moves at a constant velocity while its X,Y position change as well as its heading, $\Theta$. In some parameters regimes the dynamics become quite complicated. For example on a radial trail, (here the coordinates are distance, r, from the center of the circular trail and Psi, the heading relative to the center of the trail) , there can be many different bifurcations as the rate of turning , beta varies. This work is part of a large NSF funded grant on how animals behave in the presence of different odors.
Dynamics Near a Periodic Orbit - Dr. Jonathan Rubin
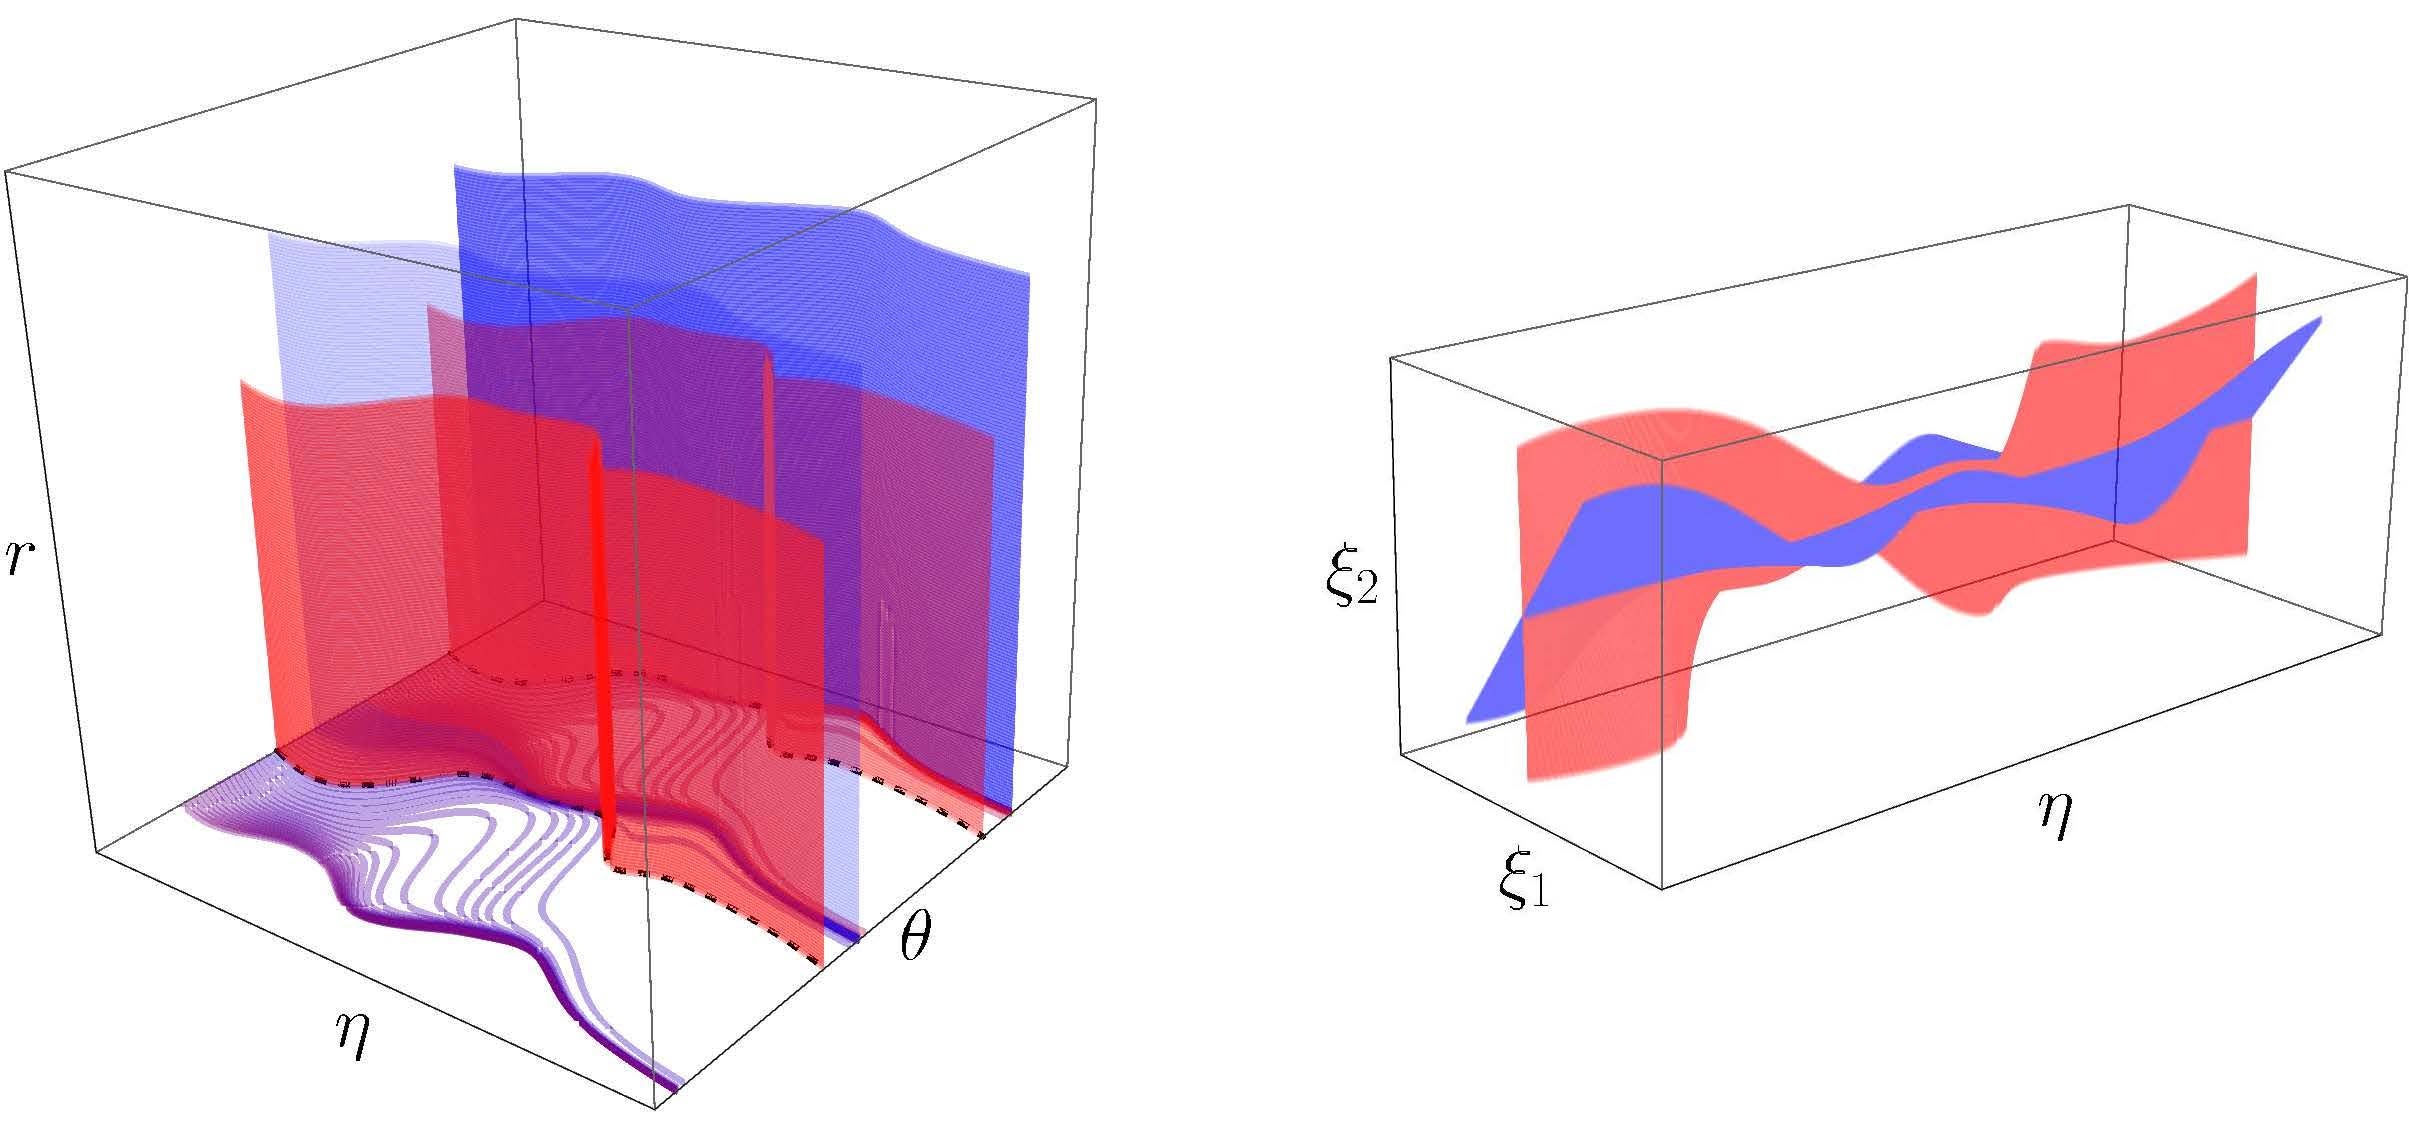

Using changes of coordinates, graduate student Ben Letson and faculty member Jonathan Rubin locate the manifolds that attract (blue) or repel (red) trajectories as they approach a periodic orbit in the famous Goodwin oscillator negative feedback system. The top two panels (Figure 1) show transformed coordinate systems; the bottom panel (Figure 2) shows the manifolds and periodic orbit (black) in the original coordinate system (from Letson and Rubin, SIAM J. Appl. Dyn. Syst. 19:58-84, 2020). Rubin’s group’s work includes development of analytical methods for dynamical systems, especially those featuring multiple distinct timescales.